Page 339 - Ferraz semiconductor DIN
P. 339

Semiconductor fuses
       Semiconductor (AC) fuses


                                 ®
       Other Protistor Fuses
       Ferrule Fuses
       27x60 gRB - 800 VAC


                               2
         Total clearing I t
                                                      DC Application data
                                                         L/R(ms)
          Ic (A)
                                                      90       1 2 3                  Um (V)
     10  5
                                                      80
                                              110 A   70
                                              100 A   60
     10  4                                    80 A    50
                                              63 A
                                                      40                          2000
                                              50 A                                       1
                                                      30
                                              40 A
     10  3                                    32 A    20                          1000
                                              25 A
                                              20 A    10                                  2
                                              16 A                                  0
                                              12 A     0                             0
     10  2                                    10 A      0                     U (V)              500  U (V)
                                              8 A         100  200  300  400  500  600  700  800  900
                                                                                    1 - L/R = 60 ms / 2 - L/R = 30 ms
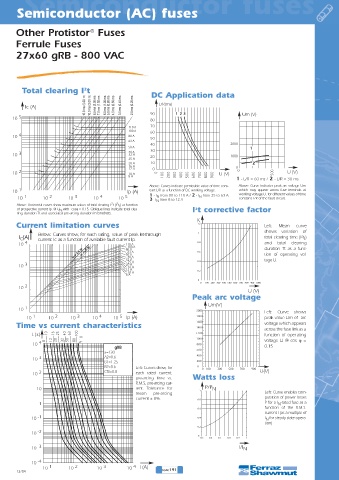
                                                      Above: Curves indicate permissible value of time cons-  Above: Curve indicates peak arc voltage Um
     10  1                                    Ip (A)  tant L/R as a function of DC working voltage.  which may appear across fuse terminals at
         1        2        3        4        5        1 - I N  from 80 to 110 A / 2 - I N  from 25 to 63 A   working voltage U, for different values of time
       10       10       10       10       10         3 - I N  from 8 to 12 A        constant L/R of the fault circuit.
                                        2 2
       Above: Horizontal curves show maximum values of total clearing I t (I t ) as function
                                           t
                                                                      2
       of prospective current Ip. @ U .with  cosϕ = 0.15. Oblique lines indicate total clea-  I t corrective factor
                      N
       ring duration Tt and associated pre-arcing duration in brackets.
                                                                      K
       Current limitation curves                                                              Left:  Mean  curve
                                                                                              shows variation of
              Below: Curves show, for each rating, value of peak let-through
        I (A)  current Ic as a function of available fault current Ip.                        total clearing time (I 2 t ) t
        C
          4                                                                                   and total clearing
       10                                    110 A
                                              100 A                                           duration Tt as a  func-
                                             80 A
                                              63 A
                                             50 A                                             tion of operating vol-
                                              40 A
                                             32 A                                             tage U.
                                              25 A
          3                                  20 A
       10                                     16 A
                                             12 A
                                              10 A
                                             8 A

          2
       10
                                                                                        U (V)
                                                                    Peak arc voltage
                                                                          Um(V)
       10  1
                                                                                              Left: Curve shows
             1      2       3       4      5
          10      10      10      10     10   Ip (A)                                          peak value Um of  arc
       Time vs current characteristics                                                        voltage which appears
                                                                                              across the fuse link as a
            t (s)  10  16  25  40  63  100                                                    function of oper-ating
            10  4  8  12  20  32  50  80  110                                                 voltage U @ cos ϕ =
                                         gRB                                                  0.15
                                      a=130
            10  3                     A2=0.6
                                      B1=1.25

                                      B2=0.6     Left: Curves show, for
            10  2                     Cf3=0.8    each rated current,                        U(V)
                                                 pre-arcing time vs.  Watts loss
                                                 R.M.S. pre-arcing cur-
              10                                 rent.  Tolerance for    P/P N
                                                 mean  pre-arcing                             Left: Curve enables com-

                                                 current ± 8%.                                putation of power losses
               1                                                                              P for a I -rated fuse as a
                                                                                                   N
                                                                                              function of the R.M.S.
                                                                                              current I (as a multiple of
            10  -1                                                                            I for steady state opera-
                                                                                              N
                                                                                              tion)
            10  -2

            10  -3                                                                   I/I N
            10  -4
                10  1    10  2     10  3      10  4 I (A)
       12/04                                              SCAC191
   334   335   336   337   338   339   340   341   342   343   344