
Page 27 - SACE Tmax XT - Technical Catalogue
P. 27
INSTALL ATION 1/23
01
—
Characteristic curves
Example of curves reading
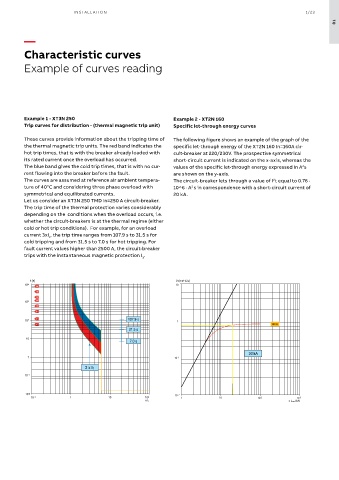
Example 1 - XT3N 250 Example 2 - XT2N 160
Trip curves for distribution - (thermal magnetic trip unit) Specific let-through energy curves
These curves provide information about the tripping time of The following figure shows an example of the graph of the
the thermal magnetic trip units. The red band indicates the specific let-through energy of the XT2N 160 In=160A cir-
hot trip times, that is with the breaker already loaded with cuit-breaker at 220/230V. The prospective symmetrical
its rated current once the overload has occurred. short-circuit current is indicated on the x-axis, whereas the
The blue band gives the cold trip times, that is with no cur- values of the specific let-through energy expressed in A s
2
rent flowing into the breaker before the fault. are shown on the y-axis.
The curves are assumed at reference air ambient tempera- The circuit-breaker lets through a value of I t equal to 0.76 ·
2
ture of 40°C and considering three phase overload with 10^6 · A s in correspondence with a short-circuit current of
2
symmetrical and equilibrated currents. 20 kA.
Let us consider an XT3N 250 TMD In=250 A circuit-breaker.
The trip time of the thermal protection varies considerably
depending on the conditions when the overload occurs, i.e.
whether the circuit-breakers is at the thermal regime (either
cold or hot trip conditions). For example, for an overload
current 3xI , the trip time ranges from 107.9 s to 31.5 s for
1
cold tripping and from 31.5 s to 7.0 s for hot tripping. For
fault current values higher than 2500 A, the circuit-breaker
trips with the instantaneous magnetic protection I .
3
t [s] I 2 t [10 6 A 2 s]
10 4 10
10 3
10 2 107.9 s 1
160 A
31.5 s
10
7.0 s
20 kA
1 10 -1
3 x I1
10 -1
10 -2 10 -2
10 -1 1 10 10 2 1 10 10 2 10 3
x I 1 x I rms [kA]